MASS::mvrnorm()Course Introduction
Psychological Sciences
Filippo Gambarota
University of Padova
Last modified: 08-12-2025
Material
Github
The material is available on Github You can find the slides, code, datasets and other stuff.
stat-teaching.github.io/GLMphd
Getting started
- Download the repository from Github. You can use the following link
- Unzip the folder
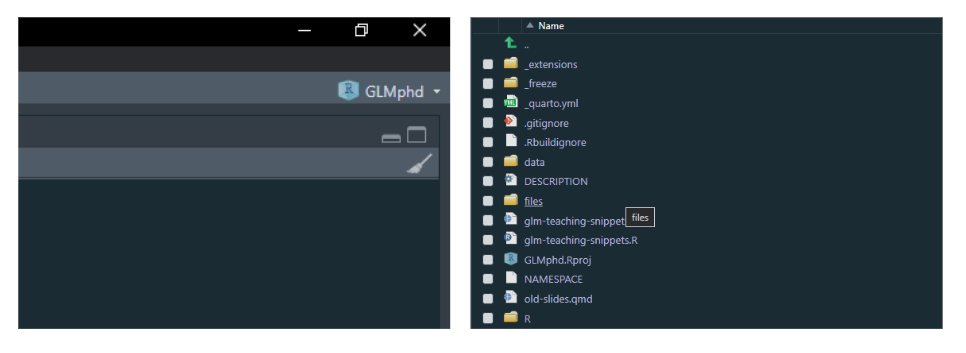
- Open the
GLMphd.Rprojfile
R
R style
I use sometimes a coding style that is not common. I try to stay as close as possible to base R. But here some general patterns that you will see:
Accessing functions within a package, if I don’t want to load it:
R style
Especially in slides or quick exploratory analysis, extensive use of pipes |> or %>%
as.character(round(mean(iris$Sepal.Length)))

# equivalent but more clear
iris$Sepal.Length |>
  mean() |>
  round() |>
  as.character()
R style
Use of the tidyverse package for data-manipulation using dplyr, tidyr, etc. Sometimes you will se a tibble object. It is only a dataframe with some extra features.
iris |>
  group_by(Species) |>
  summarise(Sepal.Length = mean(Sepal.Length))
#> # A tibble: 3 × 2
#> Species Sepal.Length
#> <fct> <dbl>
#> 1 setosa 5.01
#> 2 versicolor 5.94
#> 3 virginica 6.59# in base R
aggregate(Sepal.Length ~ Species, iris, mean)#> # A tibble: 3 × 2
#> Species Sepal.Length
#> <fct> <dbl>
#> 1 setosa 5.01
#> 2 versicolor 5.94
#> 3 virginica 6.59R style
Extensive use of *apply like function (functional programming) to make iterations. In the examples I use for loops because because is more transparent.
#>  [1]  20.090625   6.187500 230.721875 146.687500   3.596563   3.217250
#>  [7]  17.848750   0.437500   0.406250   3.687500   2.812500
# equivalent to
sapply(mtcars, mean)#> mpg cyl disp hp drat wt qsec
#> 20.090625 6.187500 230.721875 146.687500 3.596563 3.217250 17.848750
#> vs am gear carb
#> 0.437500 0.406250 3.687500 2.812500R style
For plotting I use ggplot2. Is not super easy at the beginning but it pays off.
iris |>
  ggplot(aes(x = Sepal.Length, y = Petal.Width, color = Species)) +
  geom_point() +
  geom_smooth(method = "lm")
R Studio projects
If you have trouble understanding and using the working directory and setwd() I highly suggest you to use the R Studio projects.
The *.Rproj can be created in a folder and when you open the file R Studio will open an R session setting the working directory automatically.
All the paths will be relative to the *.Rproj file. You can move the folder or share it with other people without worrying about file location.

Contents
- Overview about GLM and why they are useful
- Binomial, Poisson and Gamma GLM
- Fitting the model
- Parameters interpretation
- Diagnostic
- Simulating data
- Understanding the data generation process
- Power analysis
- (for fun 😁)
- …