library(tidyverse)
library(here)2025-03-31
Data
# loading the cleaned data version
dat <- readRDS(here("data", "emoint.rds"))
Participant-level
Let’s compute some statistics at the participant level:
Overall accuracy of the experiment:
chance_level <- 1 / length(unique(dat$response))

dat |>
    group_by(id) |>
    summarise(acc = mean(acc),
              n_trials = n()) |>
    ggplot(aes(x = acc, y = id)) +
    geom_point(aes(size = n_trials)) +
    geom_vline(xintercept = chance_level, lwd = 1, lty = "dashed")
All the participants are clearly above the chance level. For each trial there was all the 7 options.
dat |>
    filter(emotion_lbl != "neutral") |>
    group_by(id, emotion_lbl) |>
    summarise(acc = mean(acc),
              n_trial = n()) |>
    ggplot(aes(x = emotion_lbl, y = acc, fill = emotion_lbl)) +
    geom_point(aes(size = n_trial), position = position_jitter(width = 0.3, seed = 2025), alpha = 0.5, show.legend = FALSE) +
    geom_boxplot(show.legend = FALSE)
dat |>
    filter(emotion_lbl != "neutral") |>
    group_by(id, intensity) |>
    summarise(acc = mean(acc)) |>
    ggplot(aes(x = intensity, y = acc)) +
    geom_point() +
    geom_line(aes(group = id), alpha = 0.5) +
    geom_boxplot(aes(group = intensity))
Errors
dat |>
    group_by(emotion_lbl, response_lbl) |>
    count() |>
    group_by(emotion_lbl)  |>
    mutate(tot = sum(n)) |>
    ungroup() |>
    mutate(p = n / tot) |>
    mutate(is_correct = ifelse(emotion_lbl == response_lbl, 1, 0)) |>
    ggplot(aes(x = response_lbl, fill = factor(is_correct), y = p)) +
    geom_col(position = position_dodge(), show.legend = FALSE) +
    facet_wrap(~emotion_lbl, scales = "free_y") +
    theme(
        axis.text.x = element_text(angle = 90)
    ) +
        ylim(c(0,1)) +
        scale_fill_manual(values = c(scales::alpha("black", 0.5), "firebrick"))
This is the proportion of responses for each emotion label as a function of the intensity.
dat |>
    filter(emotion_lbl != "neutral") |>
    group_by(emotion_lbl, response_lbl, intensity) |>
    count() |>
    group_by(emotion_lbl, intensity) |>
    mutate(tot = sum(n))  |>
    ungroup() |>
    mutate(p = n / tot) |>
    mutate(is_correct = ifelse(emotion_lbl == response_lbl, 1, 0)) |>
    ggplot(aes(x = intensity, y = p, color = response_lbl)) +
    facet_wrap(~emotion_lbl) +
    geom_line(aes(lty = factor(is_correct)), lwd = 1) +
    scale_linetype_manual(values = c("dashed", "solid"), guide = "none")
Variability measures
Here I’m calculating a variability measure (Shannon Entropy) to capture the variability of responses for a specific intensity level for each emotion. Higher entropy means a more uncertain response.
entropy <- function(p, relative = FALSE) {
  p <- p[p > 0]  # Exclude zero probabilities to avoid log(0)
  H <- -sum(p * log2(p))

  if (relative) {
    H <- H / log2(length(p))
  }
  return(H)
}

dat |>
    filter(emotion_lbl != "neutral") |>
    group_by(emotion_lbl, response_lbl, intensity) |>
    count() |>
    group_by(emotion_lbl, intensity) |>
    mutate(tot = sum(n))  |>
    ungroup() |>
    mutate(p = n / tot) |>
    mutate(is_correct = ifelse(emotion_lbl == response_lbl, 1, 0)) |>
    group_by(emotion_lbl, intensity) |>
    summarise(entropy = entropy(p, relative = TRUE)) |>
    ggplot(aes(x = intensity, y = entropy)) +
    geom_line(aes(color = emotion_lbl), lwd = 1)
get_intersection <- function(y1, y2, x){
    x[which.min(abs(y1 - y2))]
}

get_intersection_point <- function(data){
    data <- data |>
        select(intensity, response_lbl, p) |>
        pivot_wider(names_from = response_lbl, values_from = p)
    datat <- select(data, -intensity)
    idx <- combn(1:ncol(datat), 2) # variables combination
    datat <- mutate(datat, across(everything(), replace_na, 0)) # replace NA with 0
    x <- unique(data$intensity)

    res <- vector(mode = "list", length = ncol(idx))

    for(i in 1:length(res)){
        rc <- idx[, i]
        ii <- get_intersection(datat[[rc[1]]], datat[[rc[2]]], x)
        res[[i]] <- data.frame(intensity = ii, emo1 = names(datat)[rc[1]], emo2 = names(datat)[rc[2]])
    }
    do.call(rbind, res)
}

int_point <- dat |>
    filter(emotion_lbl != "neutral") |>
    group_by(emotion_lbl, response_lbl, intensity) |>
    count() |>
    group_by(emotion_lbl, intensity) |>
    mutate(tot = sum(n))  |>
    ungroup() |>
    mutate(p = n / tot) |>
    group_nest(emotion_lbl) |>
    mutate(int_point = map(data, get_intersection_point))
Face-specific effects
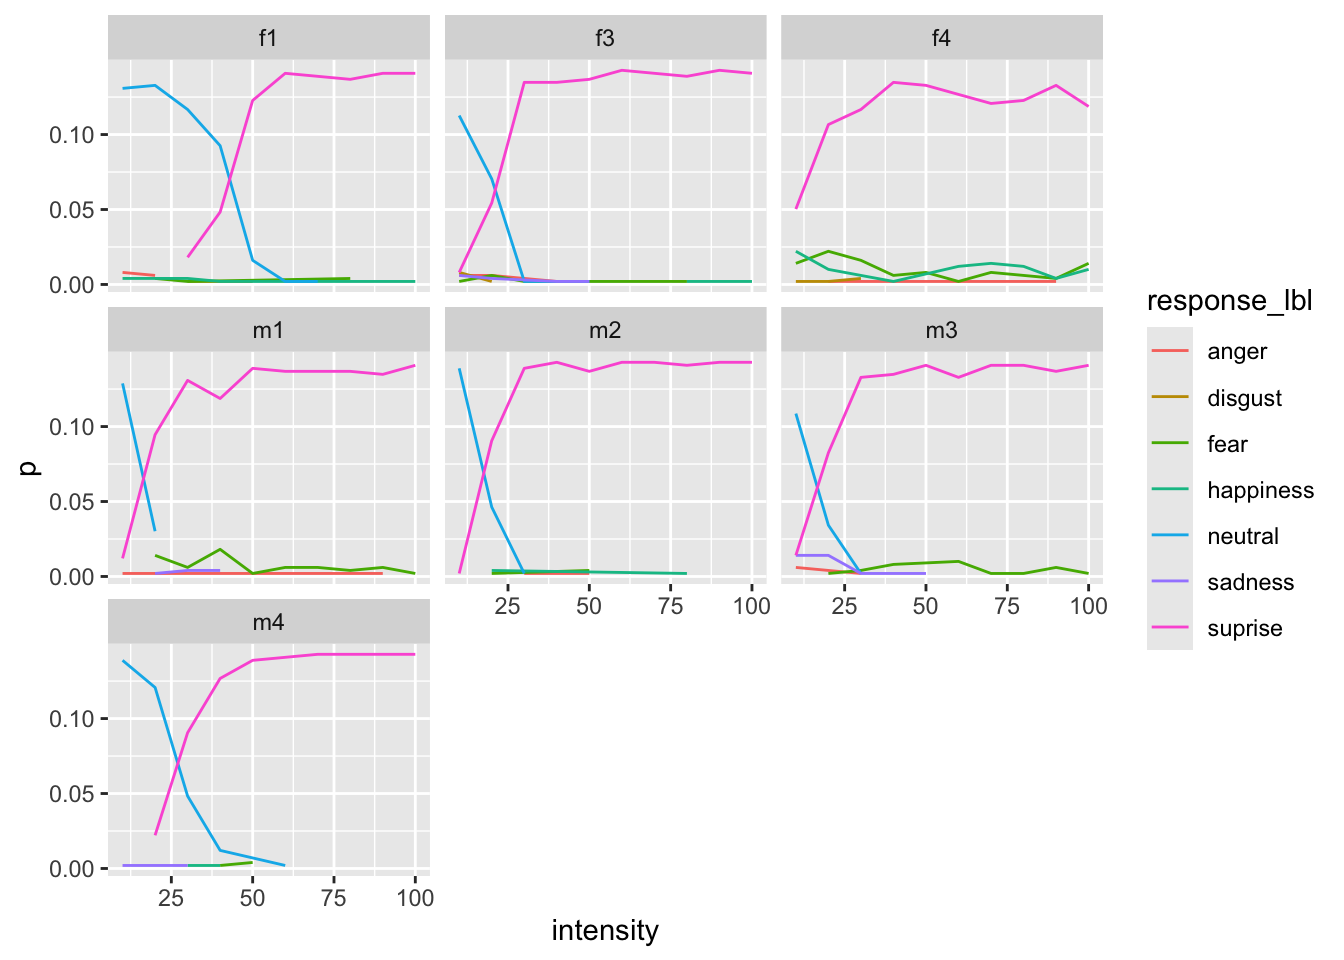
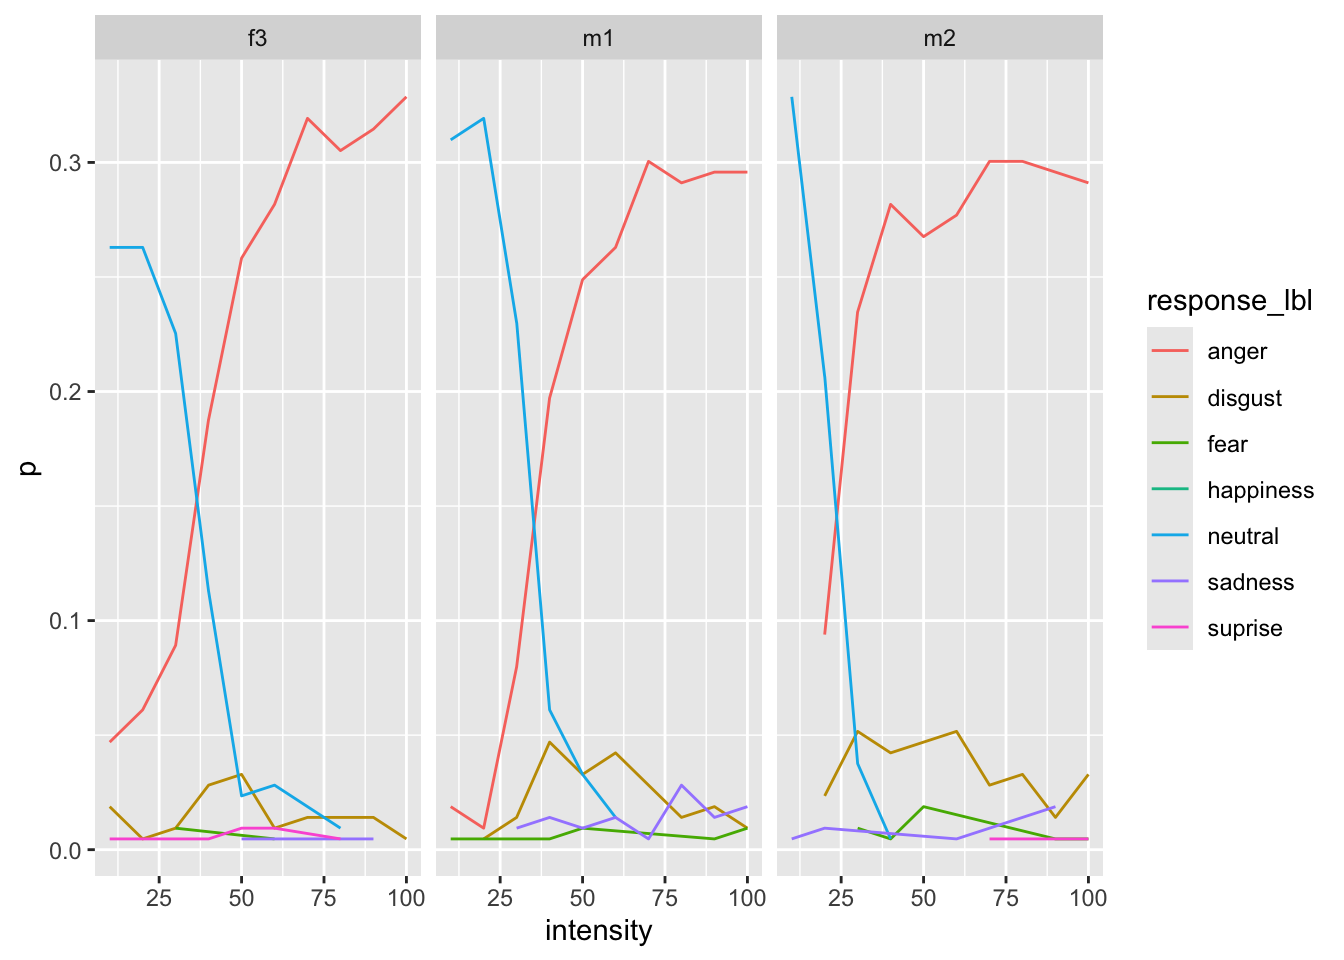
We can also visualize some identity-specific effect to see if the pattern is the same for each face.
by_face <- dat |>
    filter(emotion_lbl != "neutral") |>
    group_by(face, emotion_lbl, response_lbl, intensity) |>
    count() |>
    group_by(emotion_lbl, intensity) |>
    mutate(tot = sum(n)) |>
    mutate(p = n/tot) |>
    group_by(emotion_lbl) |>
    nest() |>
    mutate(plt = map(data, function(x){
        ggplot(x, aes(x = intensity, y = p, color = response_lbl)) +
            geom_line() +
            facet_wrap(~face)
    }))


Overall plot [try to reproduce :)]
dat |>
    filter(emotion_lbl != "neutral") |>
    ggplot(aes(x = intensity, y = acc, color = emotion_lbl)) +
    stat_smooth(aes(group = id), geom = "line", method = "glm", formula = y ~ x, method.args = list(family = binomial()), se = FALSE, alpha = 0.5) +
    facet_wrap(~emotion_lbl) +
    geom_point(position = position_jitter(height = 0.05),
    alpha = 0.05, color = "black") +
    xlab("Intensity") +
    ylab("Accuracy") +
    geom_smooth(aes(x = intensity, y = acc), method = "glm", formula = y ~ x, method.args = list(family = binomial()), se = FALSE, color = "black") +
    theme_minimal(base_size = 20) +
    theme(legend.position = "none")