library(patchwork)
library(metafor)
dat <- dat.berkey1998
rho <- seq(0.1, 0.9, 0.05)
res <- vector(mode = "list", length = length(rho))
dat$id <- 1:nrow(dat)
for(i in 1:length(res)){
V <- vcalc(vi,
cluster = author,
obs = id,
rho = rho[i],
data = dat)
fit <- rma.mv(yi, V,
mods = ~ 0 + outcome,
random = ~ outcome|trial,
data = dat, struct = "UN")
res[[i]] <- fit
}
get_res <- function(x){
out <- data.frame(
outcome = rownames(x$b),
b = x$beta[, 1],
se = x$se,
ci.lb = x$ci.lb,
ci.ub = x$ci.ub,
tau2 = x$tau2,
rho = x$rho
)
rownames(out) <- NULL
out
}
resd <- lapply(res, get_res)
resd <- do.call(rbind, resd)
resd$r <- rep(rho, each = 2)
library(ggplot2)
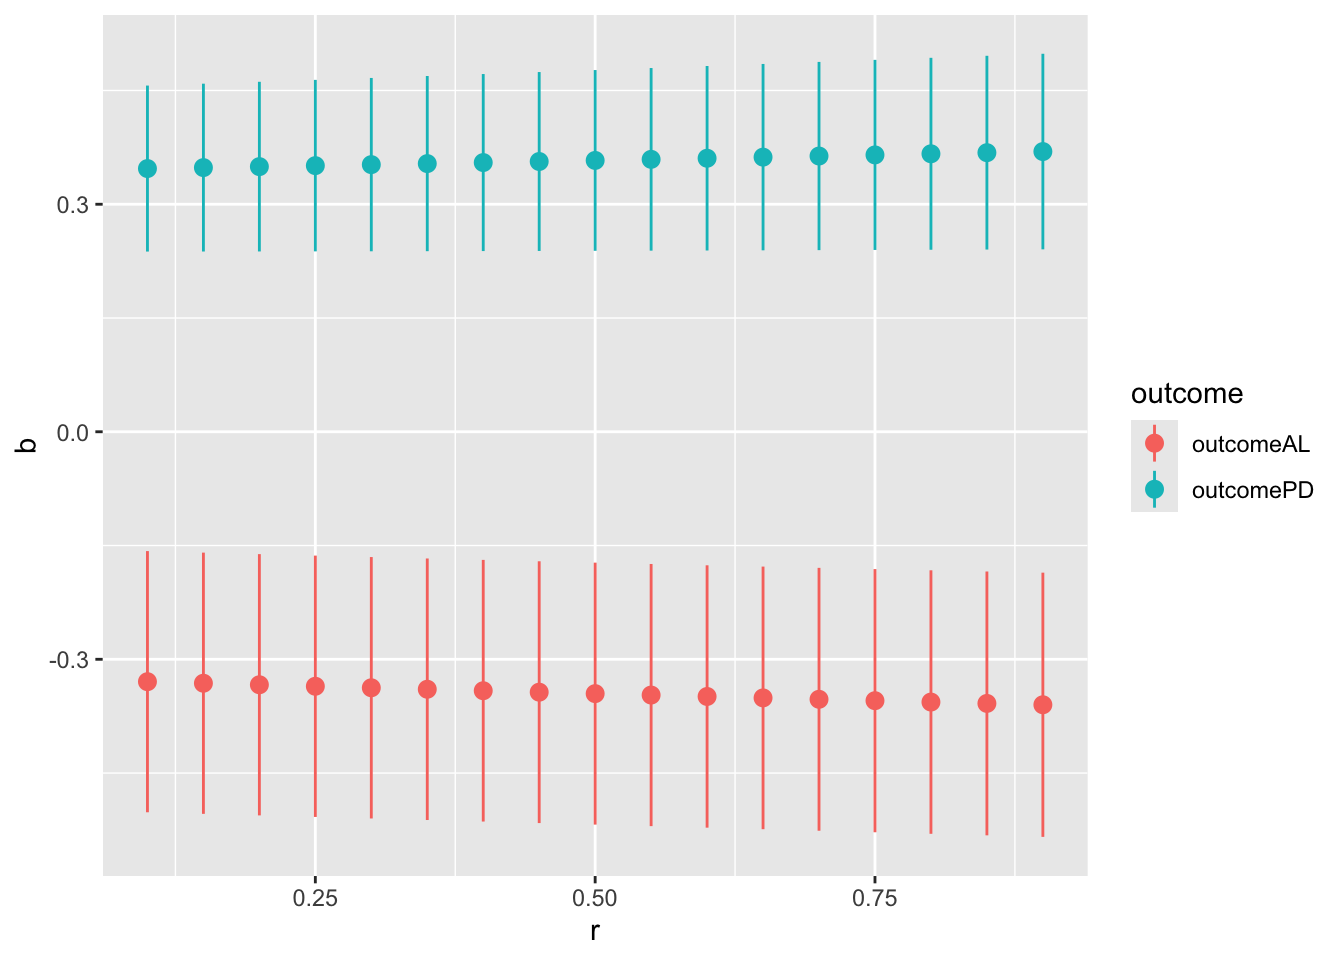
p1 <- resd |>
ggplot(aes(x = r, y = b, color = outcome)) +
geom_pointrange(aes(ymin = ci.ub, ymax = ci.lb))
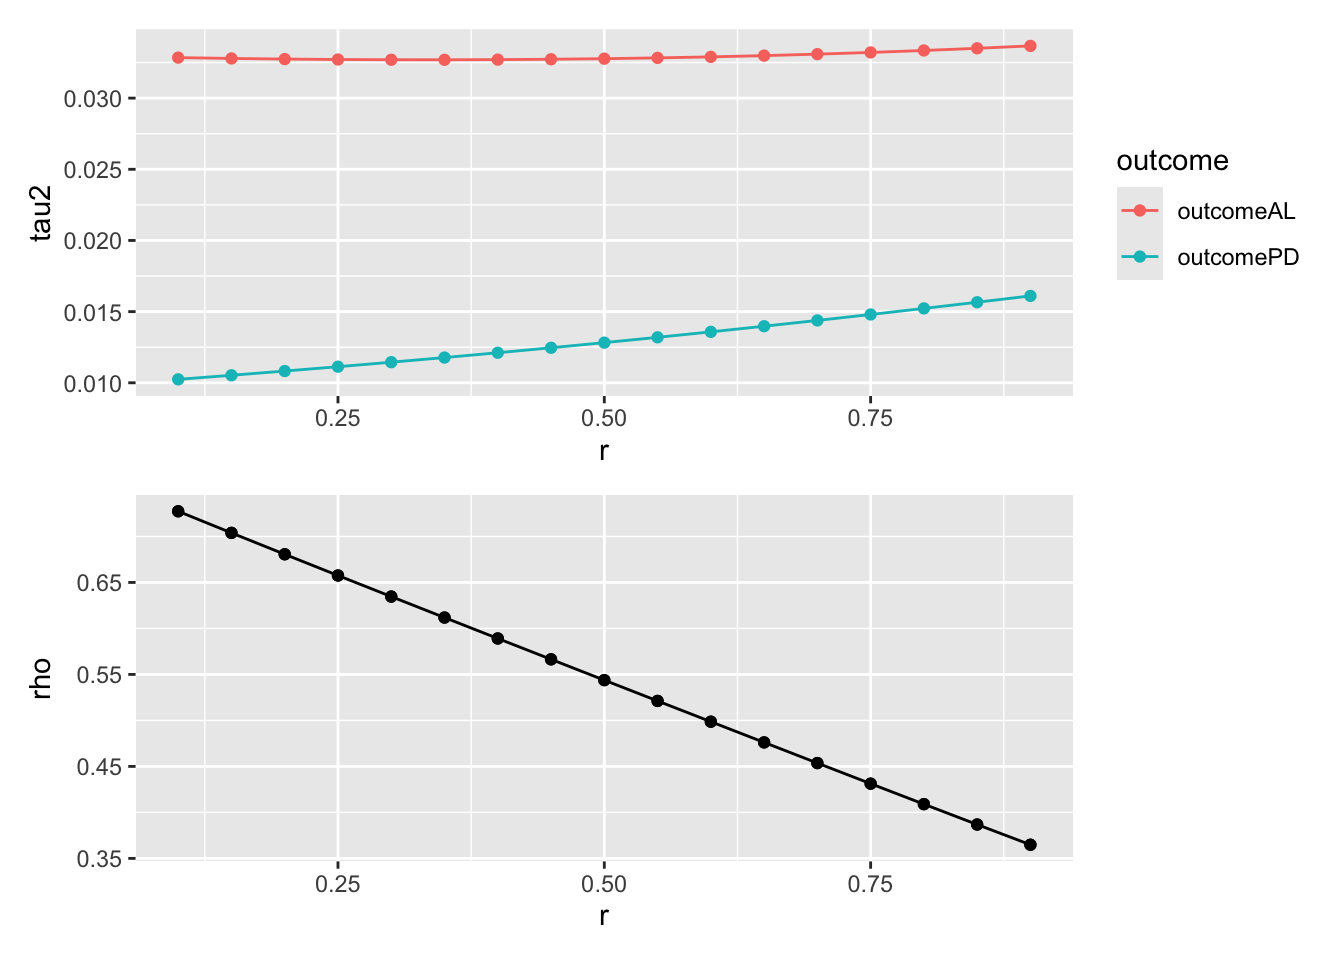
p2 <- resd |>
ggplot(aes(x = r, y = tau2, color = outcome)) +
geom_point() +
geom_line()
p3 <- resd |>
ggplot(aes(x = r, y = rho)) +
geom_point() +
geom_line()
p1